
Every budget meeting eventually arrives at the same question: which campaigns are working? It sounds simple. It's also the question many marketing leaders have paid a vendor to answer, sometimes more than once, and still find themselves defending the number in front of finance.
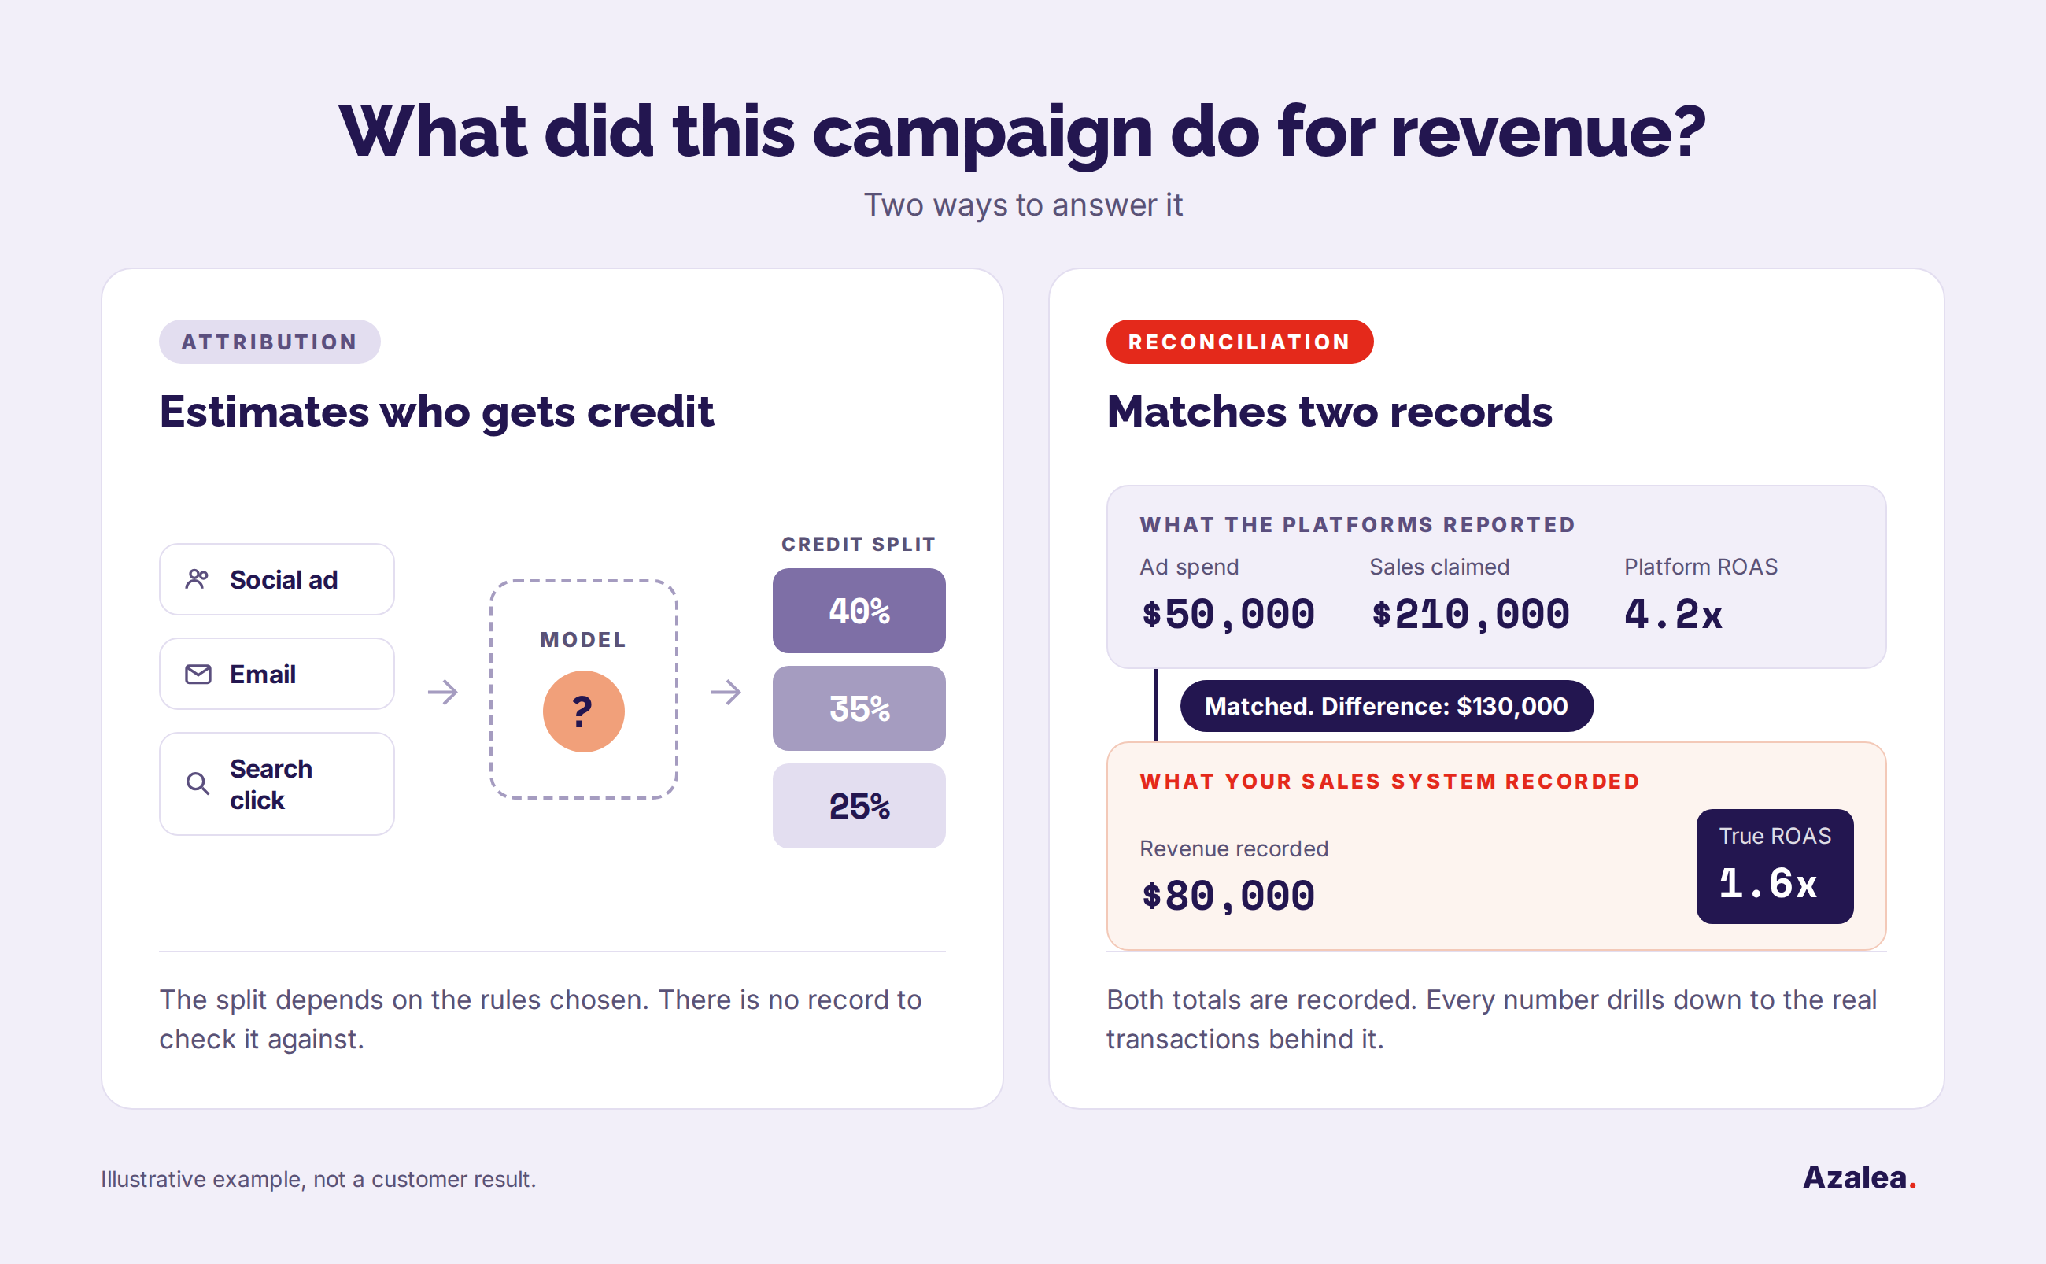
There are two very different ways to answer it. Attribution estimates how much credit each ad deserves for a sale. Reconciliation matches what your ad platforms report against what your sales system actually recorded. Both are useful. They aren't interchangeable, because they answer different versions of the question.
This article explains how each approach works, where each one is strongest, and how to decide which one your team needs. If you haven't read our first piece, Why Your ROAS Doesn't Match Your Revenue, start there. It explains the truth gap: the distance between the return on ad spend (ROAS) your platforms report and the revenue your business actually recorded.
Attribution assigns credit for a sale across the touches that came before it. In Google's words, attribution models "let you choose how much credit each ad interaction gets for your conversions" [1]. The approaches differ mainly in how that credit gets divided.
Last click gives everything to the final touch. Google describes it as giving "all credit for the conversion to the last-clicked ad and corresponding keyword" [1]. It's simple to explain, but it ignores everything that happened earlier.
Multi-touch rules spread credit across the journey. Linear splits it evenly. Time decay gives more credit to touches closer to the sale. Position-based models typically "assign 40% credit each to the first interaction and last interaction" and divide the rest across the middle [2]. Data-driven models go further, learning the split from an account's own conversion history. Google has since retired most rule-based options, noting that "less than 3% of Google Ads web conversions" used them, and made data-driven the default [3].
Pixel-based tracking supplies the raw material: code on your site that records visits and purchases and connects them to ad clicks, so the models have paths to divide. It's fast and gives marketers near real-time feedback.
Media mix modeling works from the other direction. Instead of following individual customers, it applies statistics to spend and sales over time. As Google's open-source Meridian project puts it, "MMM uses aggregated data to measure impact across marketing channels" [4].
Each approach does something well. Multi-touch models see past the last click, so upper-funnel ads get some credit. Data-driven models adapt to an account's real paths. Media mix modeling covers channels a pixel can't see, like TV, radio, and offline, and Google researchers call it "a common and widely used approach" to measuring media effectiveness [5].
Ask which attribution model is best, and each vendor will give you a different answer. The honest answer is that every model produces a different winner, and there's no recorded total to check any of them against.
Take one hypothetical customer. They click a social ad 14 days before buying, open a promotional email seven days before, then click a search ad and place a $300 order.
Illustrative example. Time-decay figures are rounded.
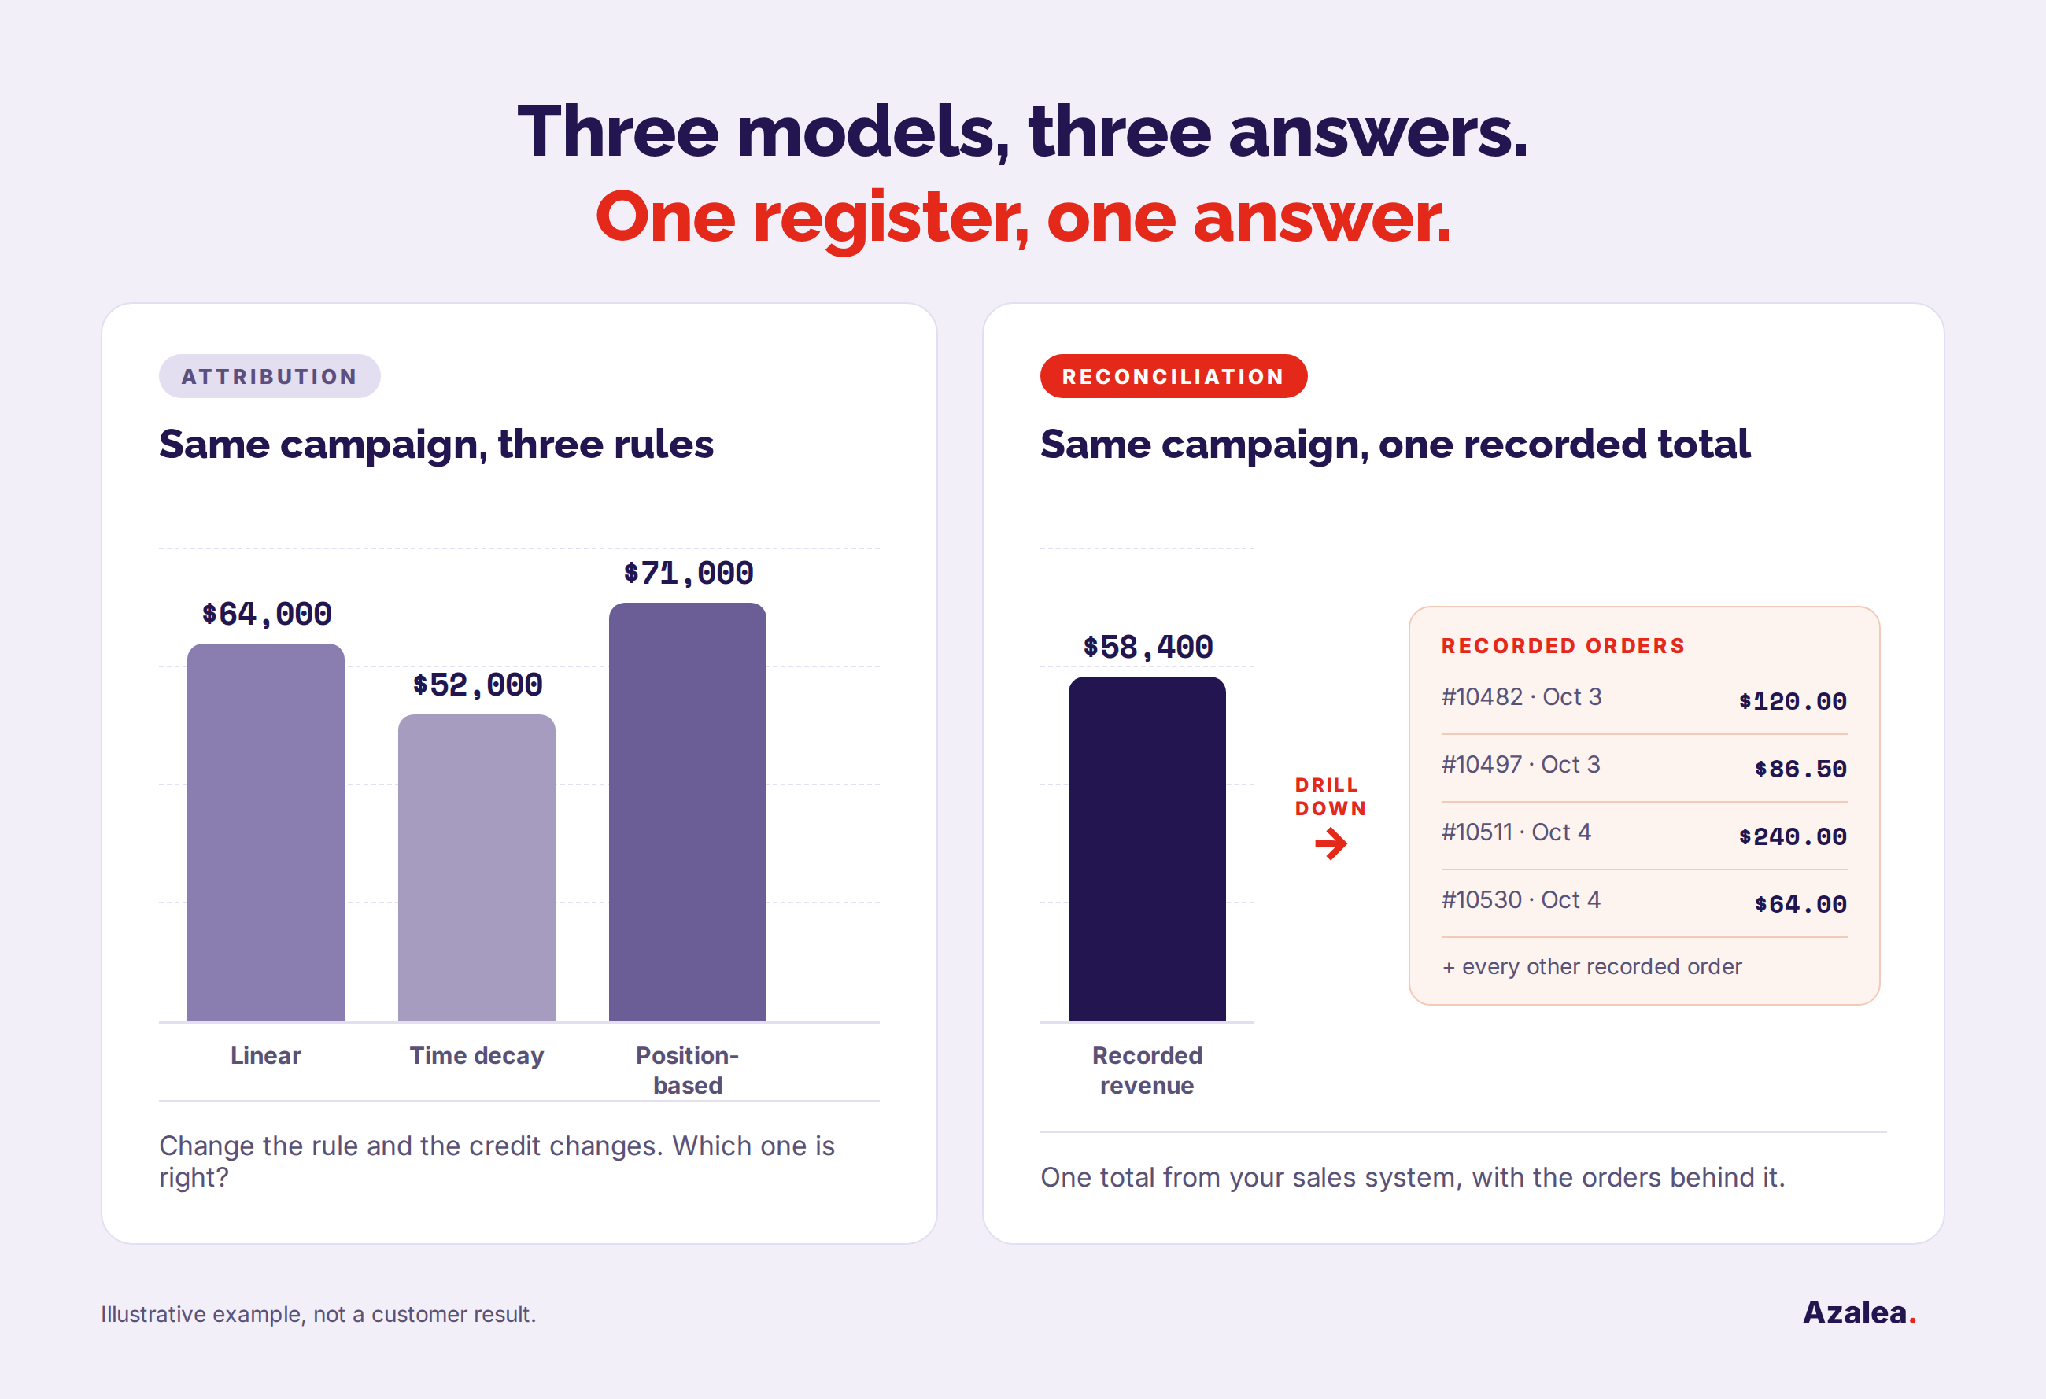
The customer journey is the same in every row. The social ad's credit ranges from $0 to $300 depending on the rule. Each split is internally consistent, and none can be verified, because no system records which touch earned the sale.
Privacy changes add a second limit. Safari blocks cookies for cross-site resources "by default across the board" [6]. Firefox gives each site "a separate 'cookie jar'" [7]. On iPhone, apps need "the user's permission" before tracking people [8]. Chrome still allows third-party cookies, so the data hasn't disappeared, but it has thinned out. Platforms fill the gaps with modeled conversions, which "use data that doesn't identify individual users to estimate conversions" [9].
The third limit is causation. Whether a touch caused a sale is hard to know for certain from attribution alone. In a peer-reviewed study of large advertising experiments, researchers found that common observational methods "often fail to accurately measure the true effect of advertising" [10].
The practical cost shows up in the CFO's office. A CMO who arrives with "here's where three models land" is asking finance to trust the math. That's a hard position: in a 2024 Gartner survey, 40% of senior marketers said their CFO was the executive most skeptical of marketing's value [11].
Start with how the numbers reach you today. Each ad platform reports the sales it believes its ads drove. In effect, ad platforms grade their own homework. A multi-touch attribution tool then steps in as a referee, settling the platforms' competing claims with a model of its own. The result is a more careful estimate, but it's still an estimate.
Reconciliation plays a different role. It's a register, not a referee.
In simple terms, reconciliation means matching two records that were kept independently and explaining the difference. Accountants do it every month with bank statements. Applied to marketing, it matches two recorded totals: what your ad platforms say you spent and sold, and what your sales system actually recorded, whether that's point of sale, e-commerce, or your CRM.
When those totals sit side by side, three things change.
First, the answer can be checked. Every number drills down to the real transactions behind it, so a CFO who questions a campaign's revenue can follow it to the actual orders or closed deals.
Take the $120 order from our first article, the one that three ad platforms each claimed as their own. Their dashboards added up to $360. Reconciliation shows one order for $120, the date it was placed, and which campaigns were in its path. Finance can open the record and see the same thing marketing sees.
Second, the rules are visible. Connecting a recorded sale to the campaigns in its path still takes rules, such as which clicks or form fills count and how far back to look. The difference is that these matching rules are written down, tuned to your business, and open to inspection, and they only ever work with sales that were actually recorded. No black-box modeling.
Third, the outputs match the questions a budget decision needs answered: which campaigns are in the path of recorded revenue, what each campaign's true ROAS (also called revenue ROAS) is, and how much revenue was sourced versus influenced.
For agencies and multi-brand operators, the same register rolls up across brands and client accounts, so a portfolio view runs on one set of rules.
Side by side
Each method was built for a different question, and the differences show up in what each one needs and what it returns.
Read across the rows and a pattern emerges. Three methods estimate or test. One matches records. That's why reconciliation works best as the base, with the other methods checked against it.
Reconciliation answers the questions a budget meeting is actually about. Which campaigns are in the path of recorded revenue? What's each campaign's revenue ROAS? How much revenue did a campaign source, and how much did it influence on the way to a sale?
It doesn't prove that a campaign caused a sale. No matching method can. That's a causal question, and the method built for it is incrementality testing: show ads to one group, hold them back from a comparable group, and measure the difference. Google's geo-based lift studies, for example, work by "aggregating unattributed conversions into non-overlapping geographic regions" and comparing regions that saw a campaign with regions that didn't [12].
Experiments are the right tool for proving lift, and they're worth running when the stakes justify it. They're also demanding. Because advertising explains only a small share of the variation in what customers buy, "even cleanly designed experiments typically require over a million subjects" to detect meaningful effects [13]. Each test answers one question for one period.
So the two aren't rivals. Incrementality asks whether the ads caused the sales. Reconciliation asks where the recorded revenue landed and what each campaign returned. A team that runs experiments still needs recorded totals to read the results against.
Start with recorded sales. Reconciliation should be your number of record, because it's the one that ties to what the business actually sold. Some decisions also call for a second method alongside it. When they do, check that method against recorded sales rather than letting it replace them.
A common version of this question is when to use multi-touch attribution versus media mix modeling. Multi-touch fits fast, in-flight optimization of digital campaigns. Media mix modeling fits annual planning across all channels, including offline. Neither one replaces a recorded total.
In every case, reconciliation is the foundation the other methods sit on. Models and experiments produce estimates. Recorded totals are what those estimates get checked against.
Reconciliation sounds simple: match two sets of records. The hard part is the plumbing. Ad platforms, point-of-sale systems, e-commerce stores, and CRMs each name and time things differently, and joining them is engineering work most marketing teams don't have on staff.
That's why Azalea assigns a forward-deployed engineer to every account to build and maintain those connections. Most clients are live in about six weeks.
See which campaigns are in the path of your recorded revenue, and let your marketing bloom.
About the Author
Karrington Ogans is a Project Manager at Azalea, specializing in the deployment of AI-driven tools and advanced technical workflows. She holds a B.A. in applied mathematical sciences from Gonzaga University and a certificate in AI prompt engineering. Throughout her career, Karrington has driven technical execution from the ground up: at the Fred Hutchinson Cancer Center, she assisted in engineering real-time object detection models and augmented reality tools for lab research, while at LabLight AR, she built custom LLM-powered AI agents to automate scientific workflows. Backed by deep hands-on experience, she focuses on managing custom datasets and presenting live technical demonstrations to audiences ranging from bench scientists to cross-functional stakeholders.