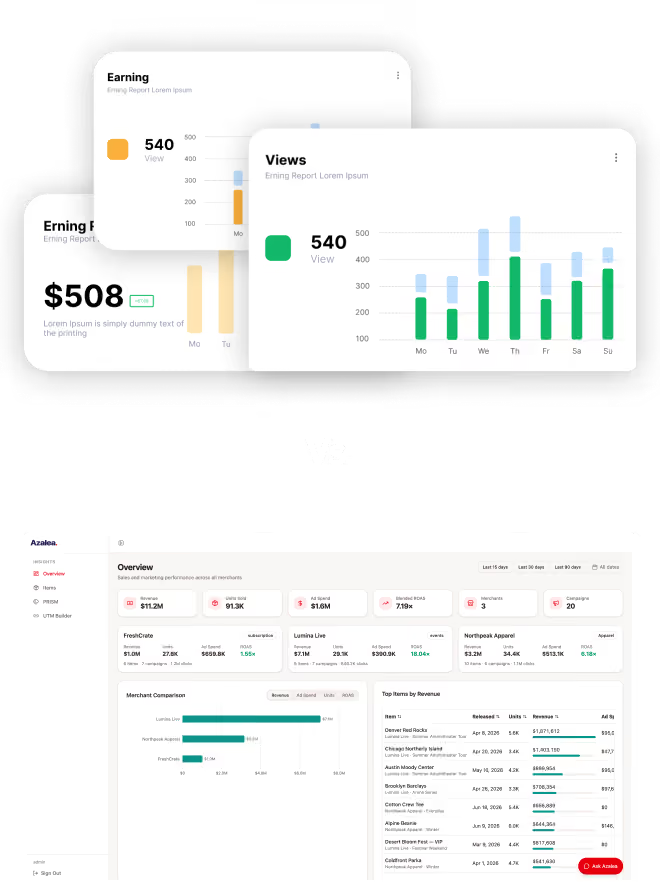
FEATURES

From your whole portfolio, down to a single ad set.

Azalea follows the way marketing teams make decisions. Start with every brand at once, check what the ads reported against what actually sold, then drill into the campaigns behind the numbers. Every view runs on the same connected data, so true ROAS means the same thing on every screen.
Book a demo
01.

See your whole portfolio

Every brand or client you manage, on one screen. Each one appears in Azalea as a merchant.
PORTFOLIO OVERVIEW

Your whole portfolio in six numbers.

Revenue, units sold, ad spend, and true ROAS across every brand, plus how many brands and campaigns are active. Switch between the last 15, 30, or 90 days, or all dates.
Portfolio Overview showing revenue, units sold, ad spend, blended ROAS, merchants, and campaigns (sample data)
MERCHANT SCORECARDS

Know how each brand is doing before you open a report.

One card per brand, with revenue, units sold, ad spend, and true ROAS, plus item, campaign, and click counts. Each card is tagged with the brand’s business type, such as subscription, events, or apparel.

Merchant Scorecards for three sample brands with revenue, units, ad spend, and ROAS
MERCHANT COMPARISON

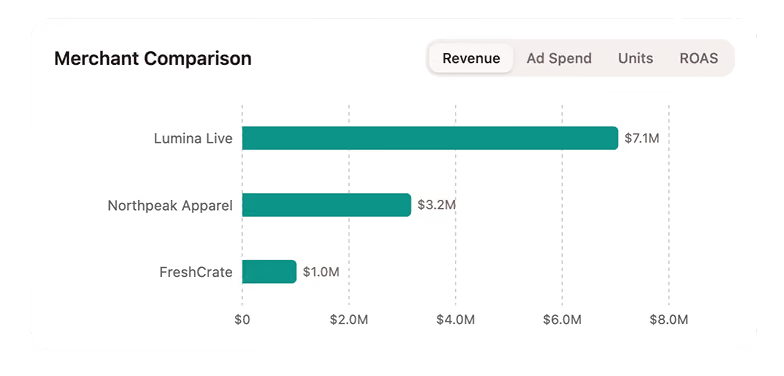
Rank every brand by what matters to you.

A ranked bar chart of your brands. Switch the measure between revenue, ad spend, units, and ROAS, and the ranking updates.
Merchant Comparison bar chart ranking sample brands by revenue
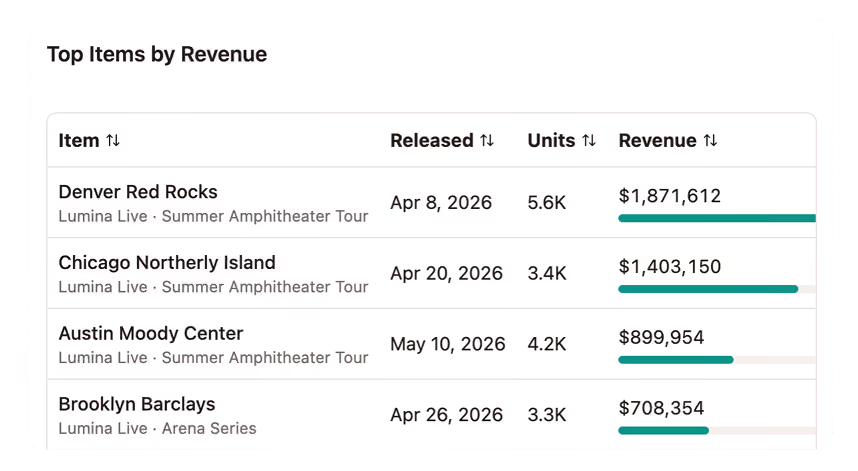
Top Items by Revenue table listing sample products, release dates, units, and revenue
TOP ITEMS BY REVENUE

See which products bring in the most money.

Your best-selling items across the portfolio, ranked by recorded revenue. Each row shows the brand, the product line, the release date, and units sold, and every column is sortable.
02.

Check ads against sales

What the platforms reported, next to what actually rang up.
THE CORE OF AZALEA
ADS VS. SALES

What your ads report, next to what 
you actually sold.

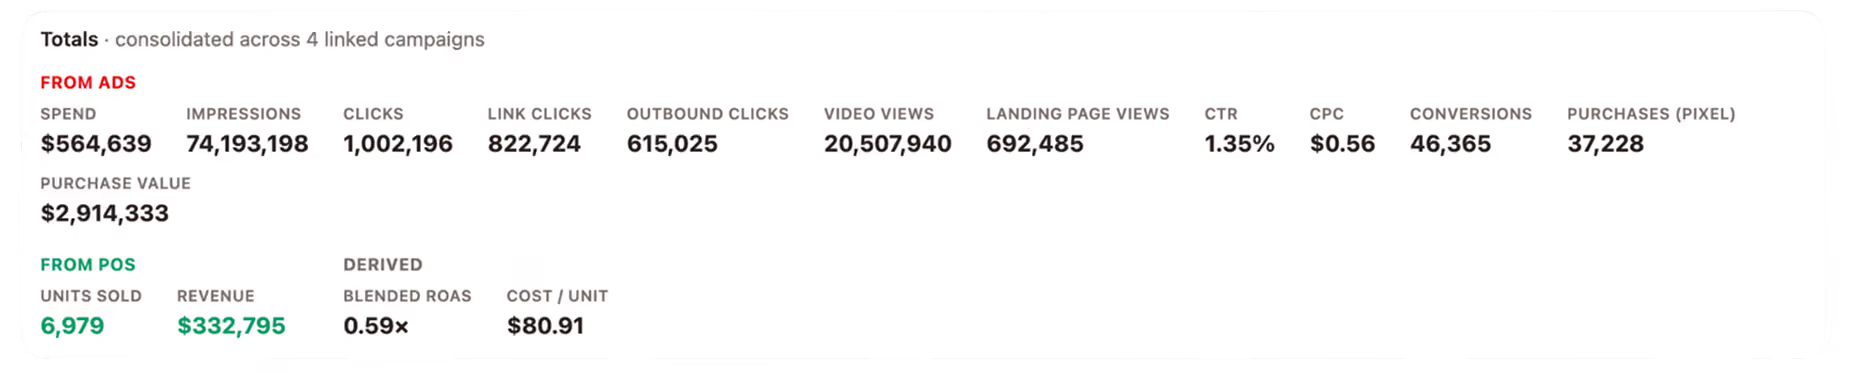
Ad platform totals sit on one side: spend, impressions, clicks, conversions, and the purchases the pixel claims. Your point-of-sale totals sit on the other: units sold and recorded revenue. Azalea derives true ROAS and cost per unit from the two, so a gap like this one is impossible to miss.
Pixel-reported purchases
$2.9M
Recorded at the register
$332,795
Ads vs. Sales totals comparing ad platform data with point-of-sale revenue (sample data)
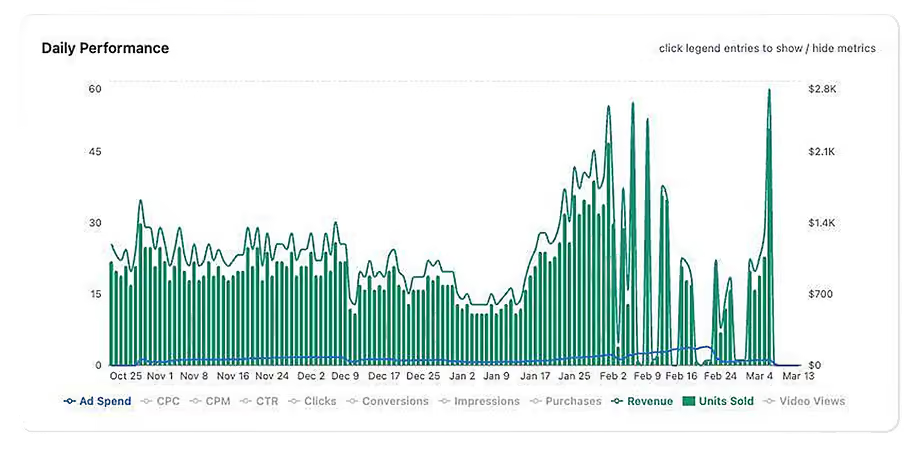
Daily chart of ad spend, revenue, and units sold over time
PERFORMANCE TRENDS

Spend and Sales on one timeline.

A daily chart that puts ad spend alongside recorded revenue and units sold, so you can see what sales did in the same period spend went up, came down, or moved between platforms. Click any metric in the legend to show or hide it.
CAMPAIGN AUDIENCE

See where your spend goes by age, gender and location.

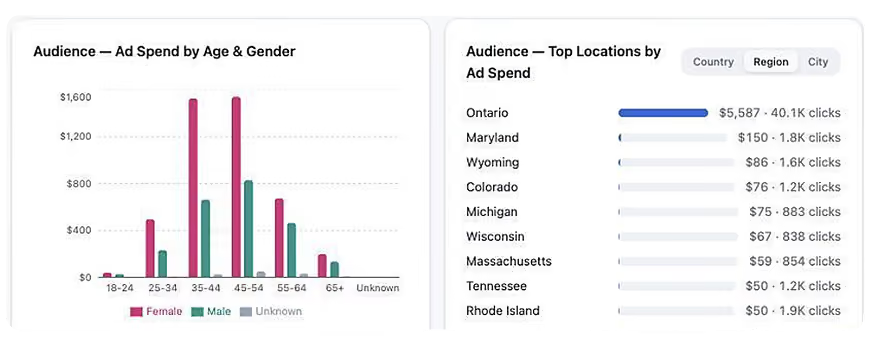
Ad spend broken down by age and gender, plus a ranked list of top locations by spend and clicks. Switch between country, region, and city.
Ad spend by age and gender, and top locations by ad spend
03.

Dig into every campaign

From the flight timeline down to individual ad sets.
CAMPAIGN INSIGHTS

Every campaign, in one timeline.

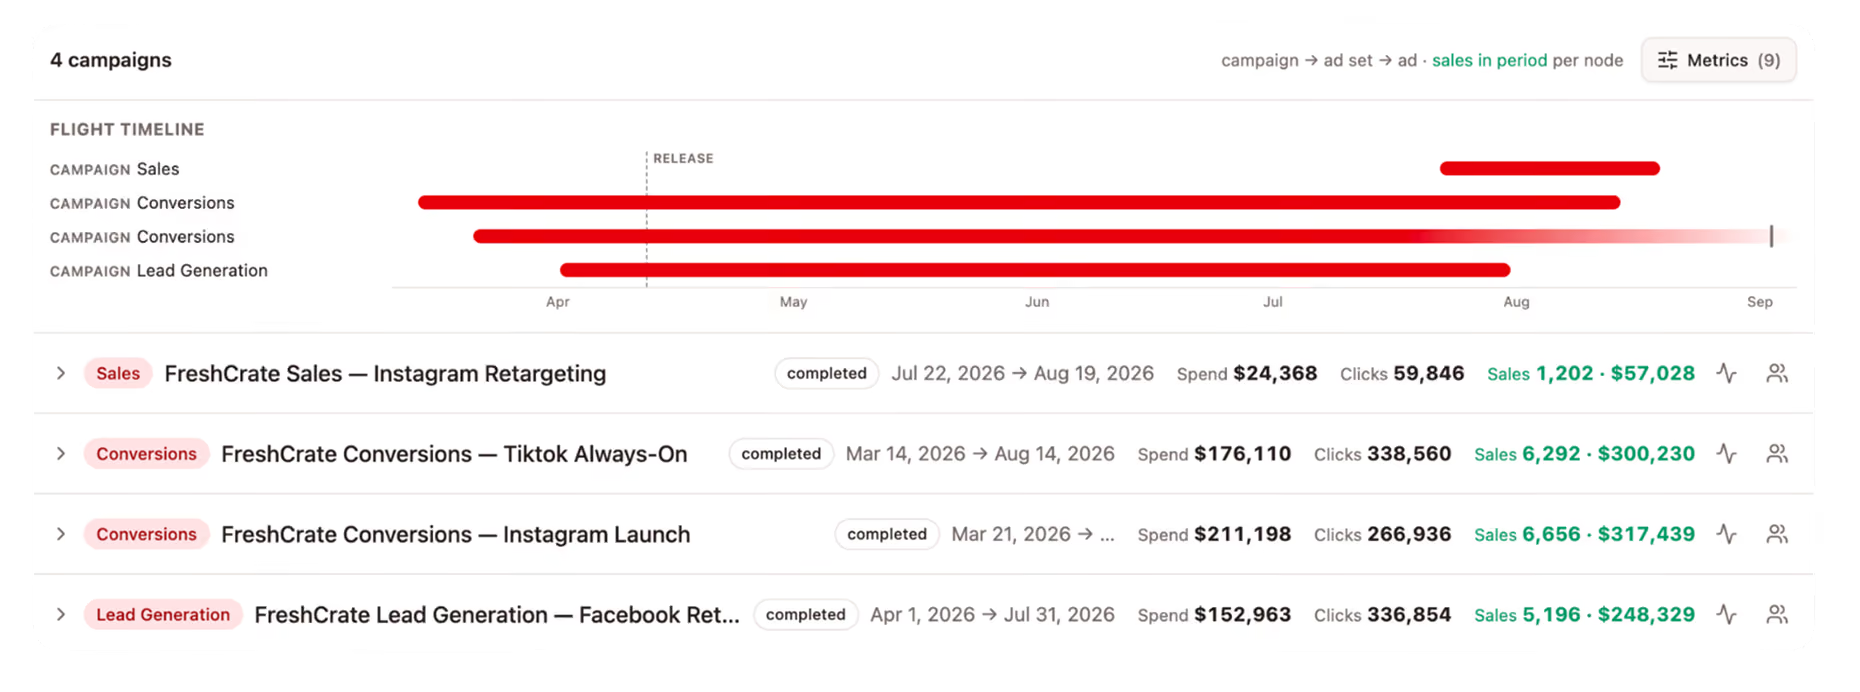
A flight timeline shows when each campaign ran, marked against the product’s release date. Below it, each campaign shows its objective, status, dates, spend, clicks, and the units and revenue your sales systems recorded in that period.
Campaign flight timeline with a list of campaigns, spend, clicks, and recorded sales
CAMPAIGN PERFORMANCE

Open any campaign and see 
what’s inside.

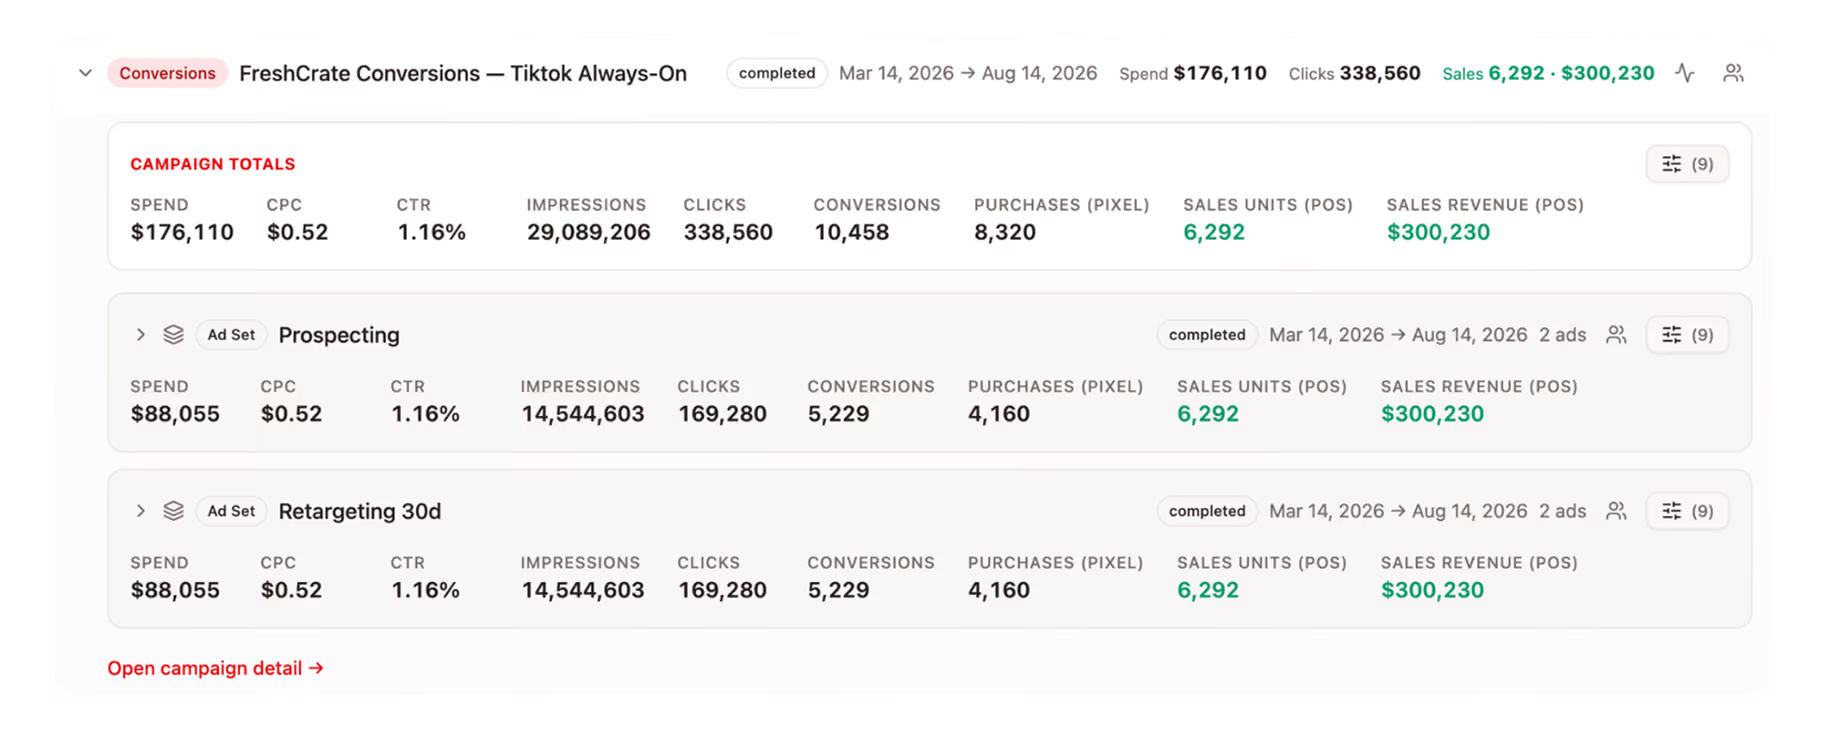
Expand a campaign to see its totals, then each ad set beneath it. At every level you see spend, CPC, CTR, impressions, clicks, conversions, and pixel purchases next to units and revenue from your point of sale.
Expanded campaign showing totals and two ad sets with spend, clicks, and recorded sales
CAMPAIGN METRICS PICKER

Show the numbers your team actually uses.

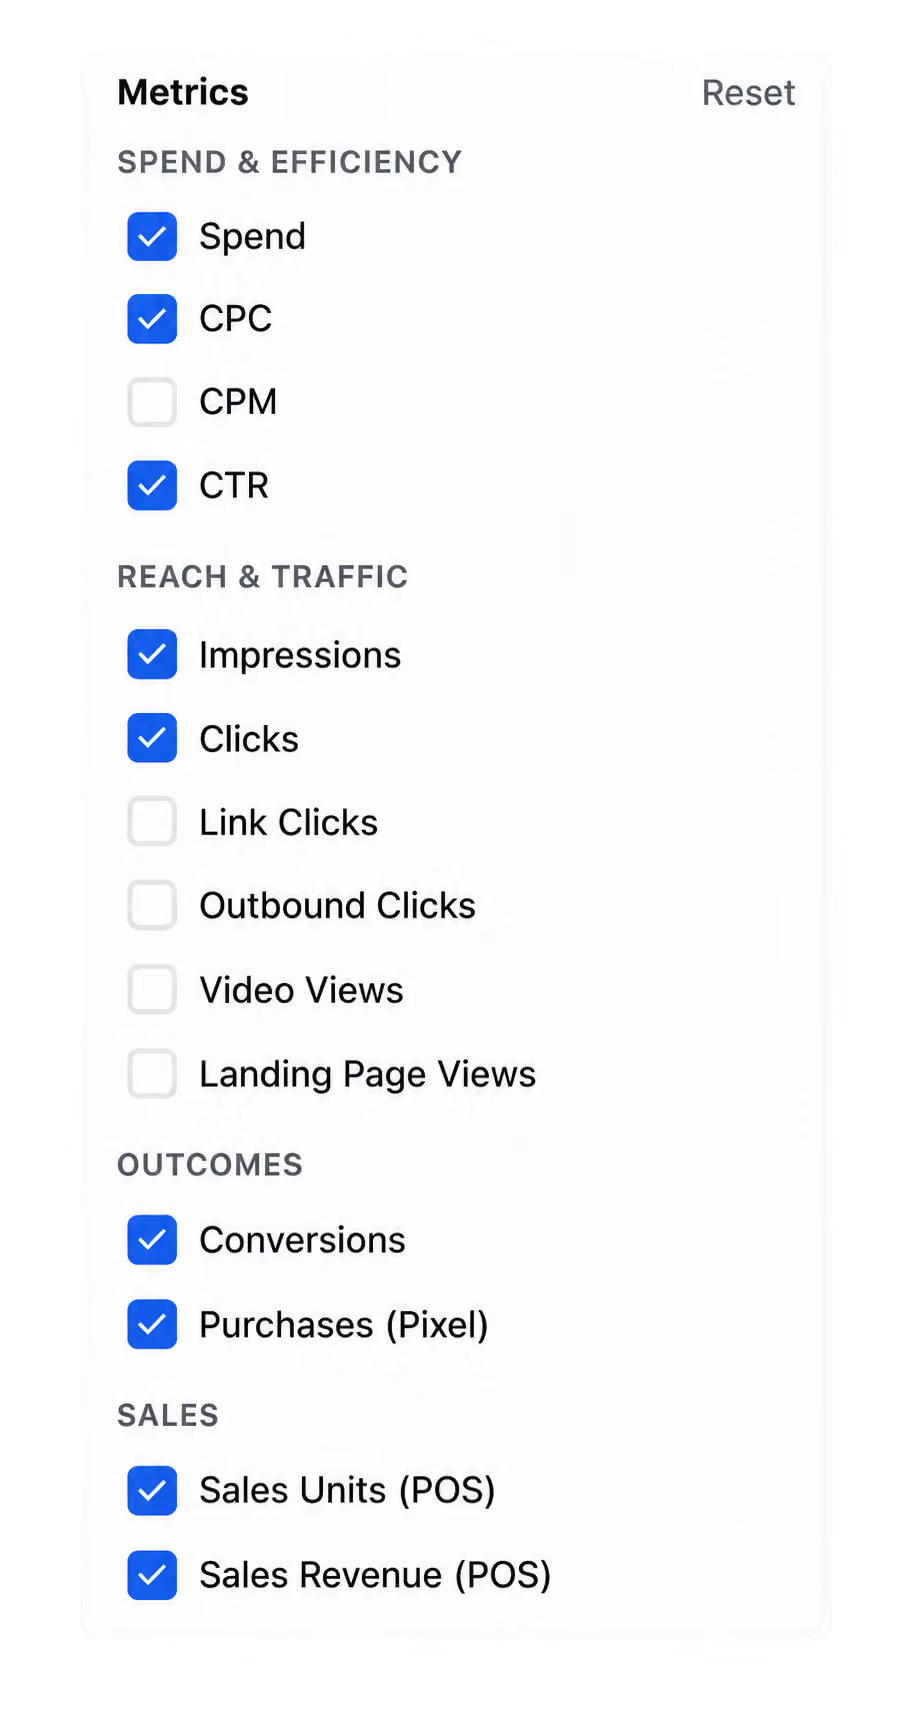
Choose which metrics appear in your campaign views, grouped into spend and efficiency, reach and traffic, outcomes, and sales. Turn on CPM or video views when you need them, and reset to the defaults in one click.
Metrics picker for choosing which campaign metrics to display
From the whole portfolio
to a single SKU
Run more than one brand? Stop stitching together separate dashboards. Azalea puts every brand's revenue, 
spend and true ROAS side by side, so you can compare them on equal terms.
Old vs new dashboard

You don't get just a login, you get an engineer.

Every Azalea account comes with a Forward-Deployed Engineer: a real person who maps your data, builds your register and keeps it honest. Bundled in, not an add-on.
Explore Azalea
Close-up of a person’s dark-skinned hand typing on a black laptop keyboard.
Included with every account
person icon
A forward-deployed engineer
Your engineer builds your connections and views, and keeps them accurate after launch
link icon
Your ad and sales platform connected
More than 40 ad platforms and sales systems, from Google Ads and Meta to Shopify and Salesforce
padlock icon
Security built in
SOC 2-complient infrastructure, encrypted connections, and strict access controls. We never share or sell your data.

See how Azalea would work for you.

Spend 30 minutes with a forward-deployed engineer. We’ll walk through Azalea, look at the ad platforms and sales systems you use today, and map out how they’d connect. If it’s a fit, the next step is a proof of concept on your own data.
Book a demo