
Picture the quarterly budget review. Marketing presents a slide showing paid media returned $210,000 in sales. Finance follows with its own report, built from what the business actually sold, and the number comes in closer to $80,000.
Neither team is lying. Both numbers come from real systems, and both were calculated correctly. They simply measure different things, and only one of them is recorded revenue.
If your ROAS (return on ad spend) doesn’t match your revenue, you know this meeting. Everyone suspects the dashboard, but nobody can prove what’s wrong with it.
The gap is less mysterious than it feels. Ad platforms use attribution models, which, in Google's words, let you choose "how much credit each ad interaction gets for your conversions" [7]. Those rules can give multiple platforms credit for the same customer.
The result is a truth gap between what marketing reports and what the business actually recorded.
The companies that sell you ads are also the companies that report how well those ads performed. In other words, ad platforms grade their own homework. The UK's Competition and Markets Authority reported that advertisers felt the largest platforms could "mark their own homework" on their own ads.
That doesn't mean the numbers are invented. But it’s important to understand that each ad platform counts conversions by its own rules, set from its own point of view. Three factors help explain the gap.
The first is the attribution window: the period after an ad interaction during which a sale can be credited to that ad. Google's default for click-through conversions is 30 days. Meta lets advertisers count conversions up to 7 days after a click. The longer the window, the more purchases an ad can claim, including ones the customer may have made anyway.
The second is view-through credit. On Meta, someone who scrolls past an ad and buys within a day of viewing it can be counted as a conversion. Google also offers 1-day view-through and 3-day engaged-view windows, but its standard conversion columns generally leave view-throughs out by default.
The third factor is modeling. Safari blocks cookies for cross-site resources by default, and apps need the user's permission to track them. To fill the gaps, platforms estimate: Google's 'Conversions' column reports both modeled and observed conversions.
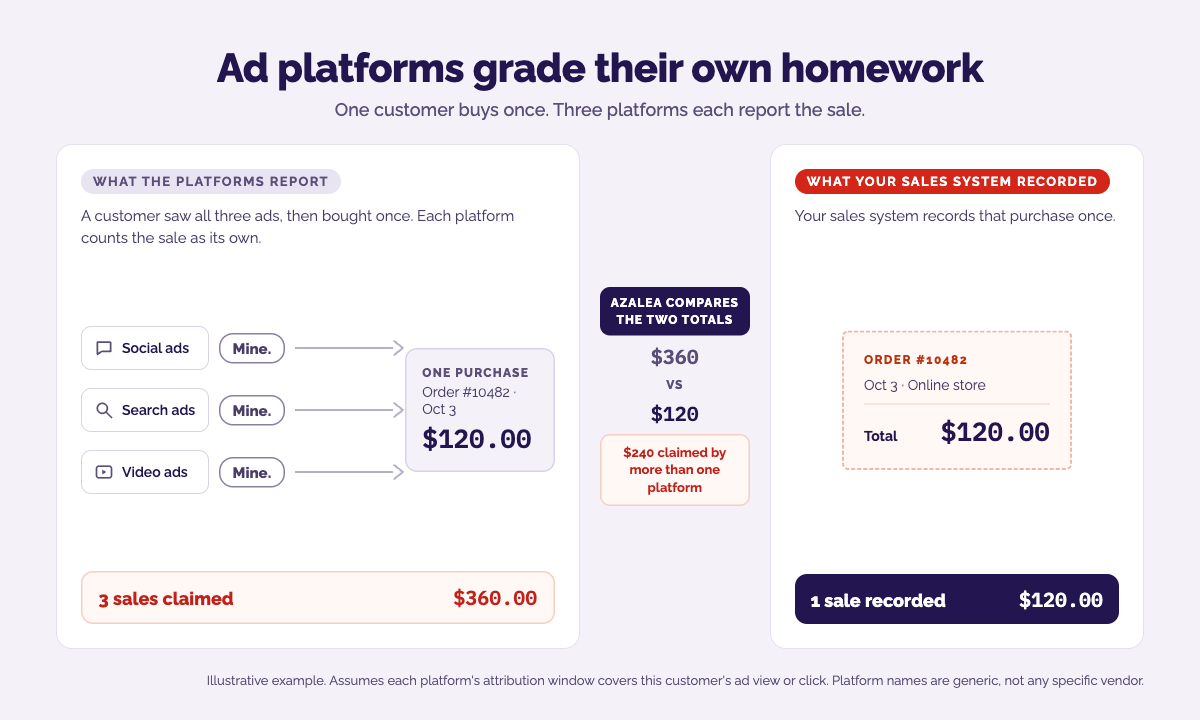
Each rule is reasonable on its own. The trouble appears when you add the platforms together, because each one applies its rules independently. Consider a customer who sees a social ad, clicks a search ad, and watches a video ad before placing a single $120 order. Every platform's window covers its touch, so all three claim the sale. Your ad dashboards now report $360 in revenue. Your store recorded $120.
That difference has a name: the truth gap.
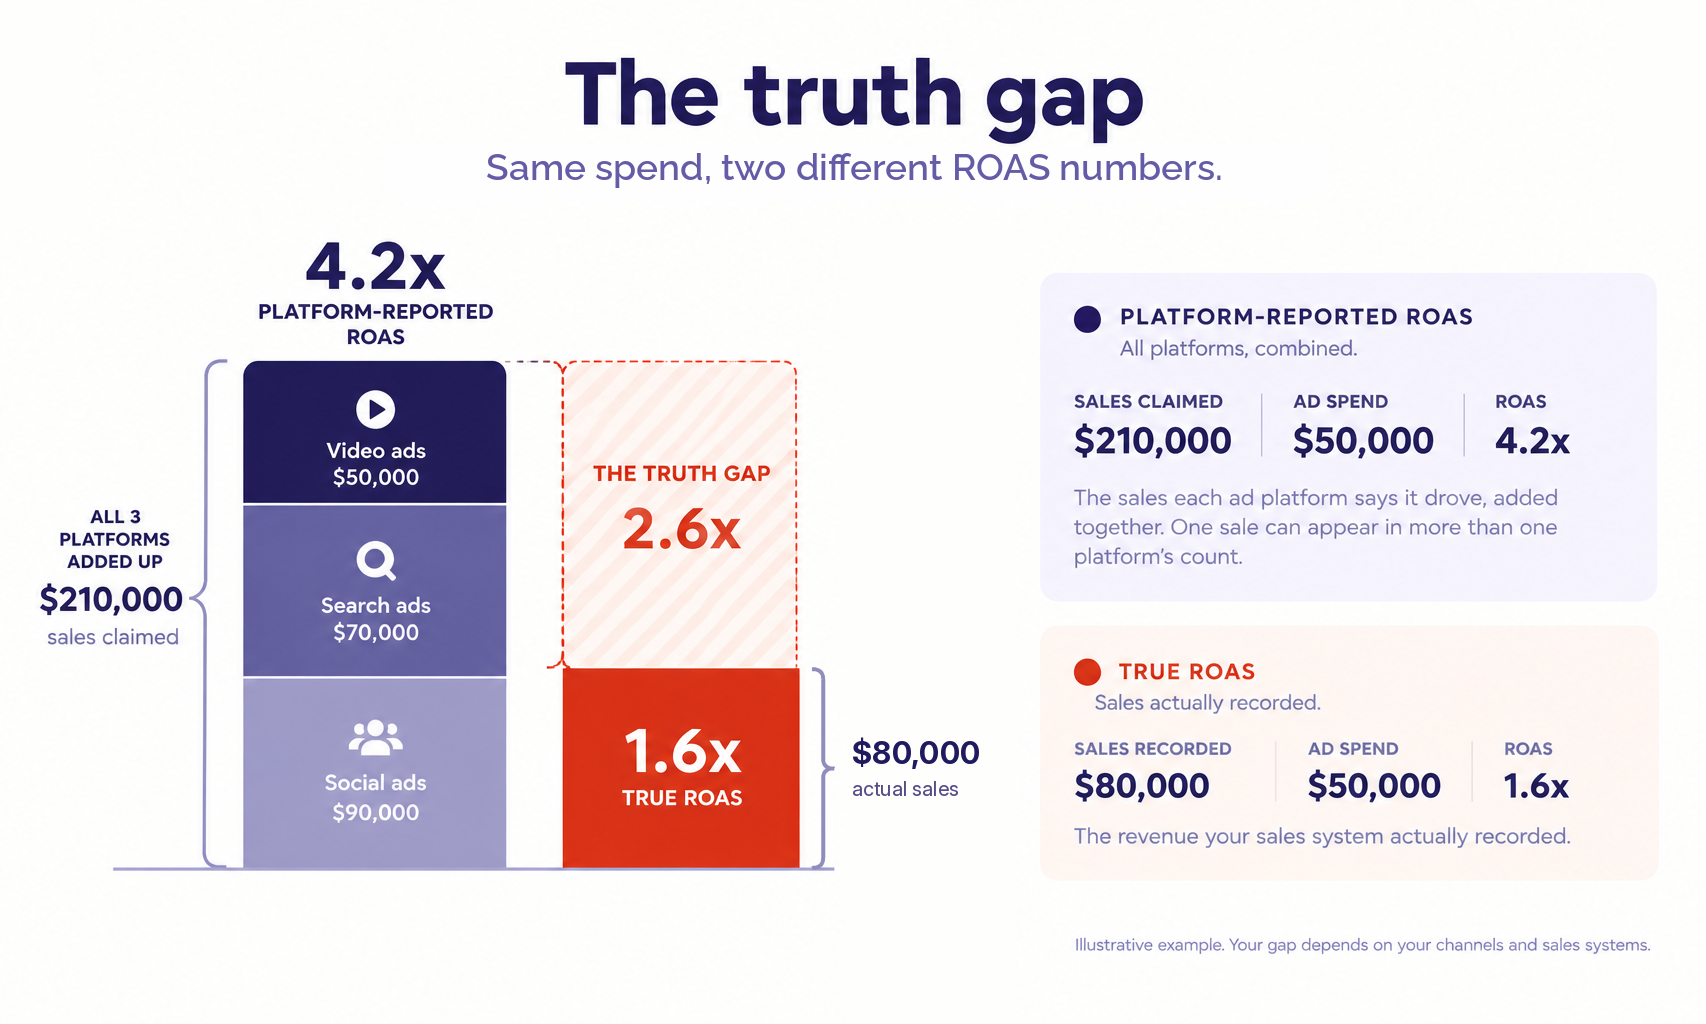
Platform-reported ROAS takes the revenue each ad platform attributes to itself and divides it by what you spent there. True ROAS, also called revenue ROAS, takes the revenue your sales systems actually recorded and divides it by the same spend.
For example, say a brand spends $50,000 across social, search, and video ads. Each platform reports the sales it helped drive, and added together they claim $210,000. Specifically, social ads claim $90,000, search ads claim $70,000, and video ads claim $50,000. This total calculates to a 4.2x platform-reported ROAS. The brand's sales systems, however, actually recorded $80,000, yielding a true ROAS of 1.6x. The space between those two numbers is the truth gap, which in this case represents a 2.6x difference.
A truth gap is more than an accounting discrepancy. It quietly shapes business decisions in three critical ways.
First, it sends the budget toward the wrong signal. When every platform grades itself, the campaigns that look strongest on the dashboard aren't always the ones that earn the most in reality. Over time, money drifts toward channels that are highly effective at claiming credit and away from channels that sit in the path of recorded sales.
Second, it erodes marketing's credibility with finance. A CFO cannot defend a number that doesn't reconcile with the bank account. In a 2024 Gartner survey of 378 senior marketing leaders, only 52% said they were successful in proving marketing's value, and CFOs topped the list of executives most skeptical of it. Every quarter the marketing and finance reports disagree, the next budget request gets harder to win. A CMO can confidently defend two recorded totals to a CFO: what the ad platforms reported and what the sales system actually recorded. “Here is where three models land” is a much harder case to make.
Third, the gap can run in the other direction. Platforms routinely miss revenue they cannot see. Sales in physical retail stores, through wholesale partners, or on custom platforms are often completely invisible to a pixel. If part of your business lives offline, the gap may be hiding underfunded campaigns, not just inflated ones.
For B2B teams: the same gap, in pipeline terms
In B2B, the disparity emerges between the prospect forms an ad platform claims and the revenue your sales organization actually books. A channel flags an initial form submission as a victory. Your reps, meanwhile, track finalized agreements in the CRM, frequently months down the line. The vital questions center on which initiatives generated an opportunity, which ones nurtured the relationship, and which channels regularly source opportunities that convert into paying clients. Ad-reporting interfaces remain blind to these answers since they lack visibility into finalized contracts. Connecting ad costs straight to internal customer data makes those answers instantly clear.
Marketing teams have tried several ways to close the gap, and each method has real strengths.
Pixel and server-side tracking sends purchase data back to the ad platforms. A pixel is a small piece of code on your website that tells an ad platform when someone who clicked or saw one of its ads makes a purchase. Server-side tracking sends the same purchase details directly from your store’s server to the platform, so it is less affected by ad blockers, cookie limits and browser privacy settings. Both are widely used and help each platform count more of your real orders. The limit is that each platform receives the data separately and applies its own attribution rules, so the same order can still be credited by more than one platform. The tracking also sees only the sales systems it is connected to, so phone, in-store or marketplace sales are often missed, and setting it up and keeping it working usually falls to your internal team.
Multi-touch attribution (MTA) models spread credit across the touchpoints in a customer's journey, which produces a richer, more nuanced picture than last-click measurement. The tradeoff is that an algorithm assigns the credit, and you cannot check the result against a recorded total. Even standard tools rely heavily on this; for example, the 'Data-driven' model is the default attribution model for most conversion actions in Google Ads.
Media mix models (MMM) use deep statistics to estimate how much each channel contributes to revenue over time. Open-source frameworks such as Google's Meridian and Meta's Robyn have made them far more accessible, and they are well suited to high-level, long-range budget planning. Their primary limit is precision: they estimate channel-level contribution rather than campaign-level revenue that an operator can drill into day-to-day.
Spreadsheets are where most marketing teams start. The approach works fine until channels, sales systems, or sub-brands multiply, and then the process breaks quietly under its own weight.
Taken together, these approaches share one critical limit. Each one estimates or infers credit, or leaves the matching entirely to you, instead of matching two recorded totals.
If platforms grade themselves and attribution tools referee the platforms with models of their own, reconciliation plays a distinctly different role. It keeps a register.
Reconciliation is how you connect ad spend to revenue. It matches two independently recorded totals: what your ad platforms say you spent and sold, and what your sales systems actually recorded, wherever that revenue lives. When those totals sit side by side, the truth gap becomes instantly visible by brand, by campaign, and by product. Every number drills down to the real transactions behind it, and the matching rules are visible, so you can see exactly why a sale landed where it did. No black-box modeling.
Remember that single $120 order claimed by three different platforms? Each platform claims the same sale, but the sales system records it exactly once. Reconciliation takes those three overlapping claims ($360 claimed) and matches them against the single recorded receipt ($120 recorded), exposing the $240 difference.
Reconciliation does not claim to prove that a click strictly caused a sale. As the UK CMA noted, attribution on its own does not establish causality; measuring incremental impact takes further analysis, such as experiments. Reconciliation focuses instead on the questions a budget decision actually needs answered: which campaigns are in the path of recorded revenue, what each campaign's revenue ROAS is, and what revenue was sourced versus influenced.
You can start to estimate your own truth gap this week in three steps.
Doing this manually once is manageable. Doing it every month is exactly where the process breaks down. Each platform uses different windows and naming conventions, sales often live in several disparate systems, and every additional brand or geography multiplies the manual work.
Azalea is revenue-connected marketing analytics. It matches your ad spend against actual recorded sales across every brand you run, and a forward-deployed engineer on every account builds and maintains the connections for you. Most clients are live in about six weeks.
See your truth gap on your own data, and let your marketing bloom.
About the Author
Karrington Ogans is a Project Manager at Azalea, specializing in the deployment of AI-driven tools and advanced technical workflows. She holds a B.A. in applied mathematical sciences from Gonzaga University and a certificate in AI prompt engineering. Throughout her career, Karrington has driven technical execution from the ground up: at the Fred Hutchinson Cancer Center, she assisted in engineering real-time object detection models and augmented reality tools for lab research, while at LabLight AR, she built custom LLM-powered AI agents to automate scientific workflows. Backed by deep hands-on experience, she focuses on managing custom datasets and presenting live technical demonstrations to audiences ranging from bench scientists to cross-functional stakeholders.