The quarterly budget review is going well. Marketing's slide shows paid media returned 4.2x, the strongest number of the year. Then the CFO asks one question: "Where does that revenue show up in our books?"
The room goes quiet, because the honest answer is that it doesn't, at least not in that form. Marketing's numbers come from the ad platforms. Finance's numbers come from the sales system and the invoices. Both are real, but they're counted differently, and only one of them matches the books.
It's a common bind. In a 2024 Gartner survey, "only 52% of CMOs and other senior marketing leaders said they were successful in proving the value of marketing," and CFOs topped the list of executives most skeptical of it [1].
This guide shows how to bring a number your CFO can check, and how to answer the questions that come next.
None of what follows is wrongdoing. It's how ad platforms count, and each rule makes sense on its own. For a deeper look, see our article Why Your ROAS Doesn't Match Your Revenue. The trouble is that a CFO can't check any of it against the books. Four reasons come up the most.
Shared credit. Each platform reports the sales it helped with. Picture a customer who sees a social ad on Monday, clicks a search ad on Wednesday, and watches a video ad before buying on Friday. That's one sale, but all three platforms can count it. Add the platform reports together and the total is bigger than anything the sales system shows.
Modeled conversions. Sometimes a platform can't track a purchase directly. The customer may have declined tracking cookies, switched from phone to laptop, or used a browser that limits tracking. Google notes that "Some browsers (for example, Safari and Firefox) don't allow conversion measurement using third-party cookies" [2]. So platforms estimate the conversions they believe happened and add them in. Google says it plainly: "In the 'Conversions' column, Google reports both modeled and observed conversions" [2]. The estimates are reasonable, but a CFO can't match an estimate to an order.
View-through conversions. A platform can also take credit when someone saw an ad but didn't click, as long as the purchase lands within a set window. Meta lets advertisers count events "within 1-day after an impression of your ad" [3]. Google handles these separately, keeping them out of its main Conversions column and reporting them in a "View-through conversions" column instead [4]. Seeing an ad is a looser link to a sale than clicking one, and the rules differ from platform to platform.
Windows and dates. Each platform decides how long after a click or view it will still claim a sale. Meta, for example, credits purchases "if they happened within a certain number of days after someone viewed or clicked on your ad" [5]. Platforms can also date a sale differently than finance does. Google notes that it "reports conversions on the ad impression date," while other tools use the date of the conversion [6]. A purchase made on April 2 from an ad seen on March 30 can land in March on the platform and in April in the books. So platform numbers rarely line up with the month or quarter finance closes.
The fix is to build your number from the same records finance uses. This is called a source of record: the system a number officially comes from, and where anyone can look it up.
Two numbers matter, and each has a source of record.
Recorded sales come from your sales system: your e-commerce platform, point of sale, or order system. These are the orders that actually happened, counted once each. If you sell through more than one channel, like an online store and retail locations, pull recorded sales from each one for the same dates.
Ad spend comes from what the platforms actually billed you: invoices and billing statements, not the running total in an ads dashboard. If a dashboard and an invoice disagree, use the invoice. It's what the business actually paid.
Put them together and you get true ROAS:
True ROAS = recorded sales ÷ ad spend
Both inputs come from a source of record, so finance can check either one quickly. Azalea calculates true ROAS this way, using recorded sales only. It doesn't add estimates or modeled conversions to the sales side.
Expect the result to be smaller than platform ROAS. In the illustrative example from the opening, the platforms reported $210,000 in sales on $50,000 of spend, a 4.2x return. Recorded sales were $80,000, a true ROAS of 1.6x. That smaller number is the point. It holds up when someone checks it, and a number that holds up is one you can build a budget on.
To see how matching ad spend to recorded sales works across platforms and brands, read Two Ways to Answer "What Did My Ad Spend Do?": Attribution vs. Reconciliation.
Once you have true ROAS, put the platforms' combined claim right next to recorded sales.
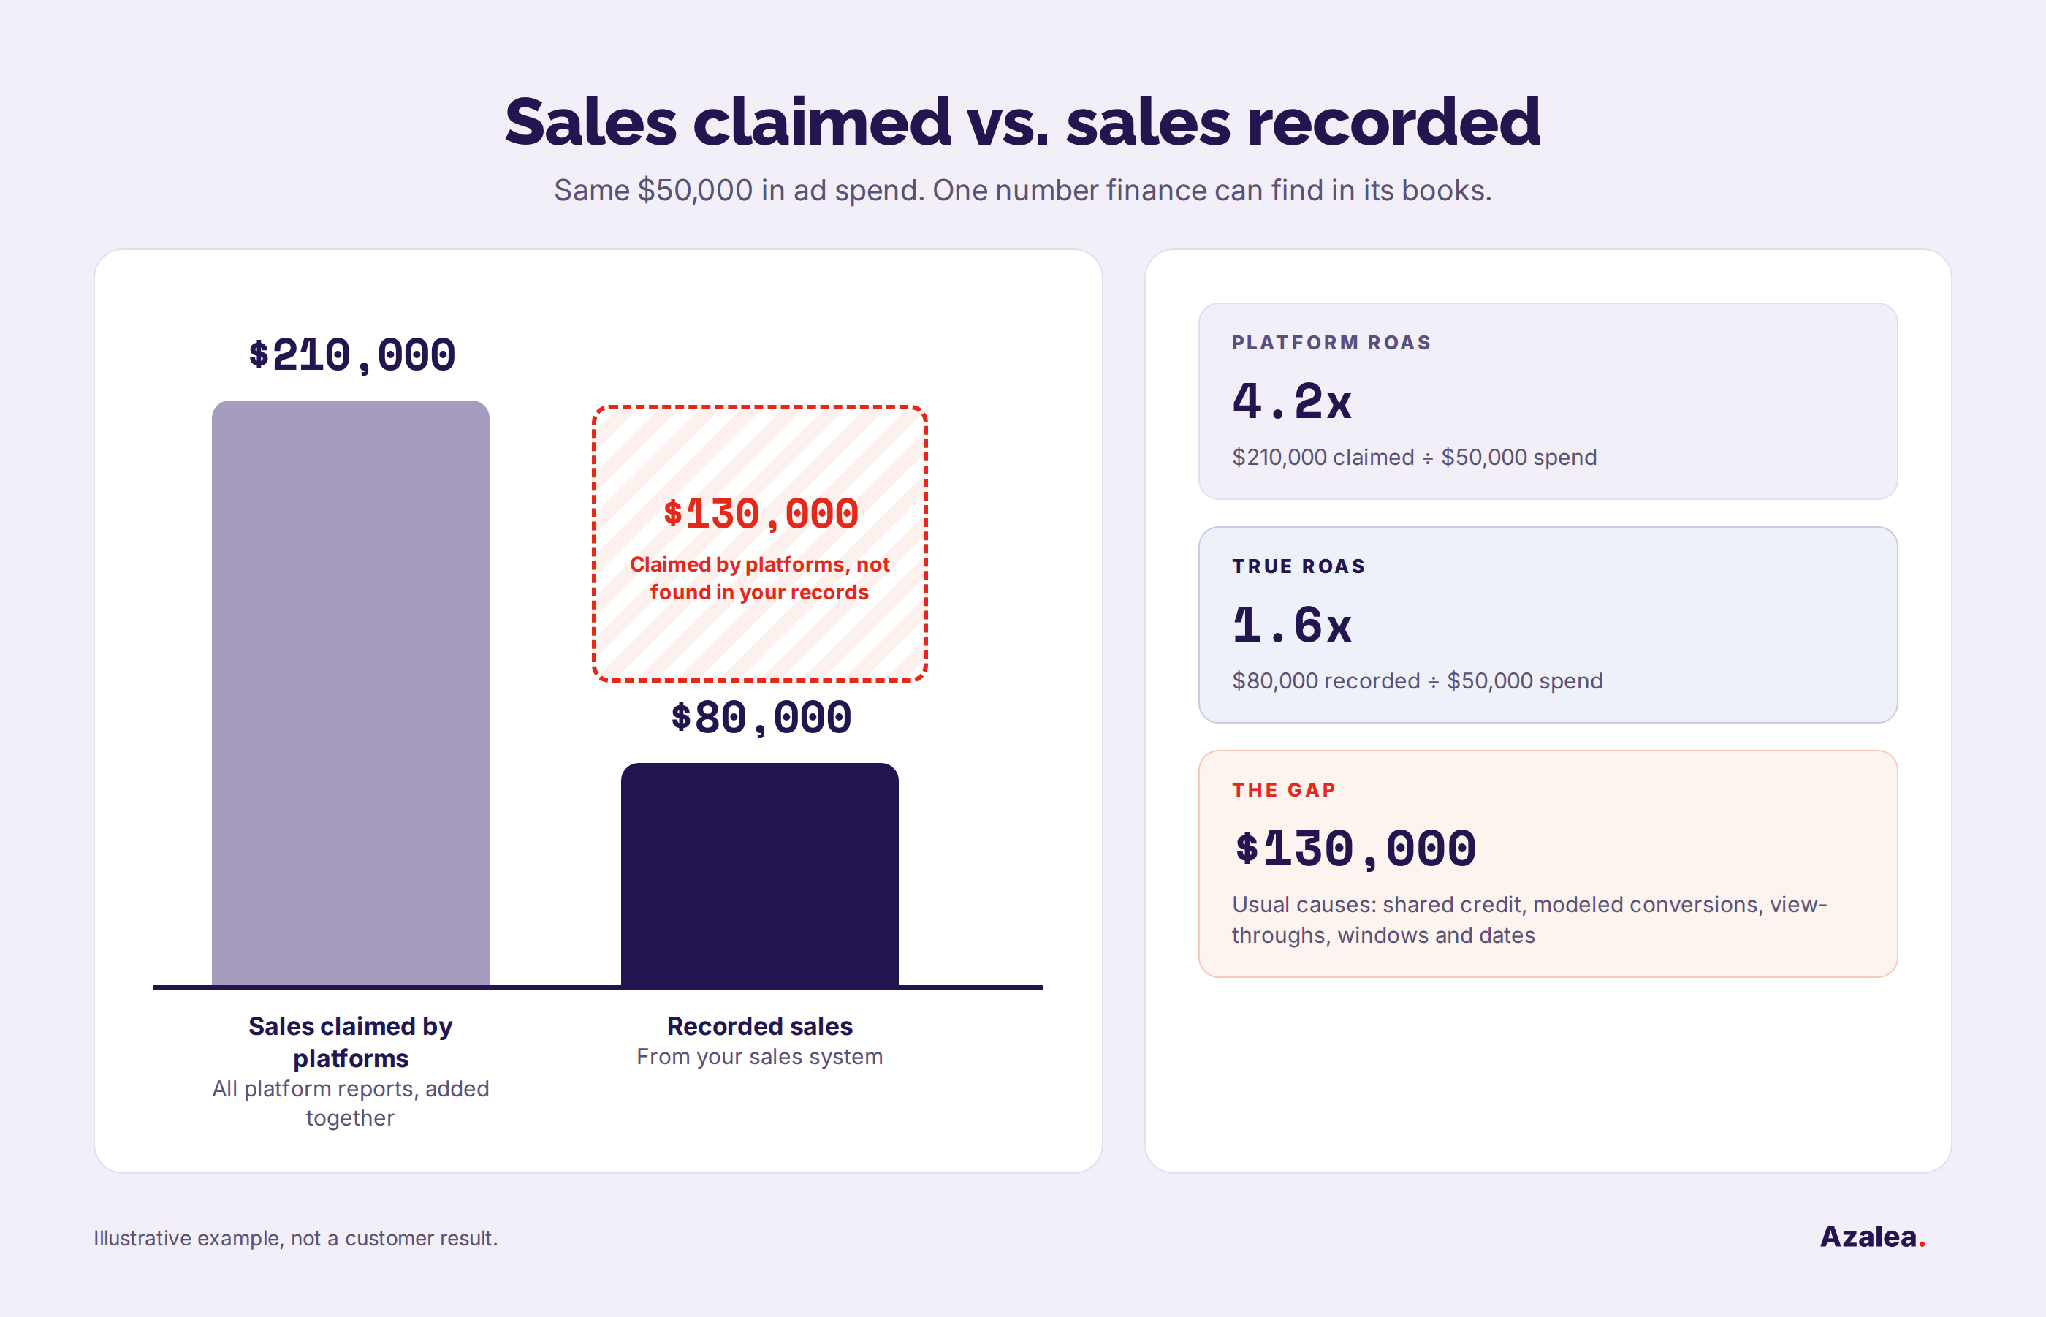
Illustrative example.
The difference has a simple name: sales claimed by the platforms but not found in your records. In this example, that's $130,000. Put it on the page as its own line, clearly labeled, so nobody has to do the subtraction in their head. Showing it yourself also makes clear you're not hiding anything.
Don't try to explain it line by line. The four reasons above are the usual explanations: shared credit, modeled conversions, view-throughs, and windows and dates. Name them as the likely causes, but don't put a dollar figure on each one. Recorded sales tell you what was sold. They don't break down why the platforms counted more.
What you can do is track the gap over time. A gap that holds steady from quarter to quarter is easy to explain: it's how your platforms count, and nothing has changed. A gap that jumps is worth a closer look, since it can point to a change in settings, tracking setup, or channel mix.
None of this makes platform numbers useless. They're still the right tool for running campaigns day to day: comparing ads, adjusting bids, and spotting what's working inside each platform. They just aren't the number to take to finance.
Skip the dashboard. Bring one page.
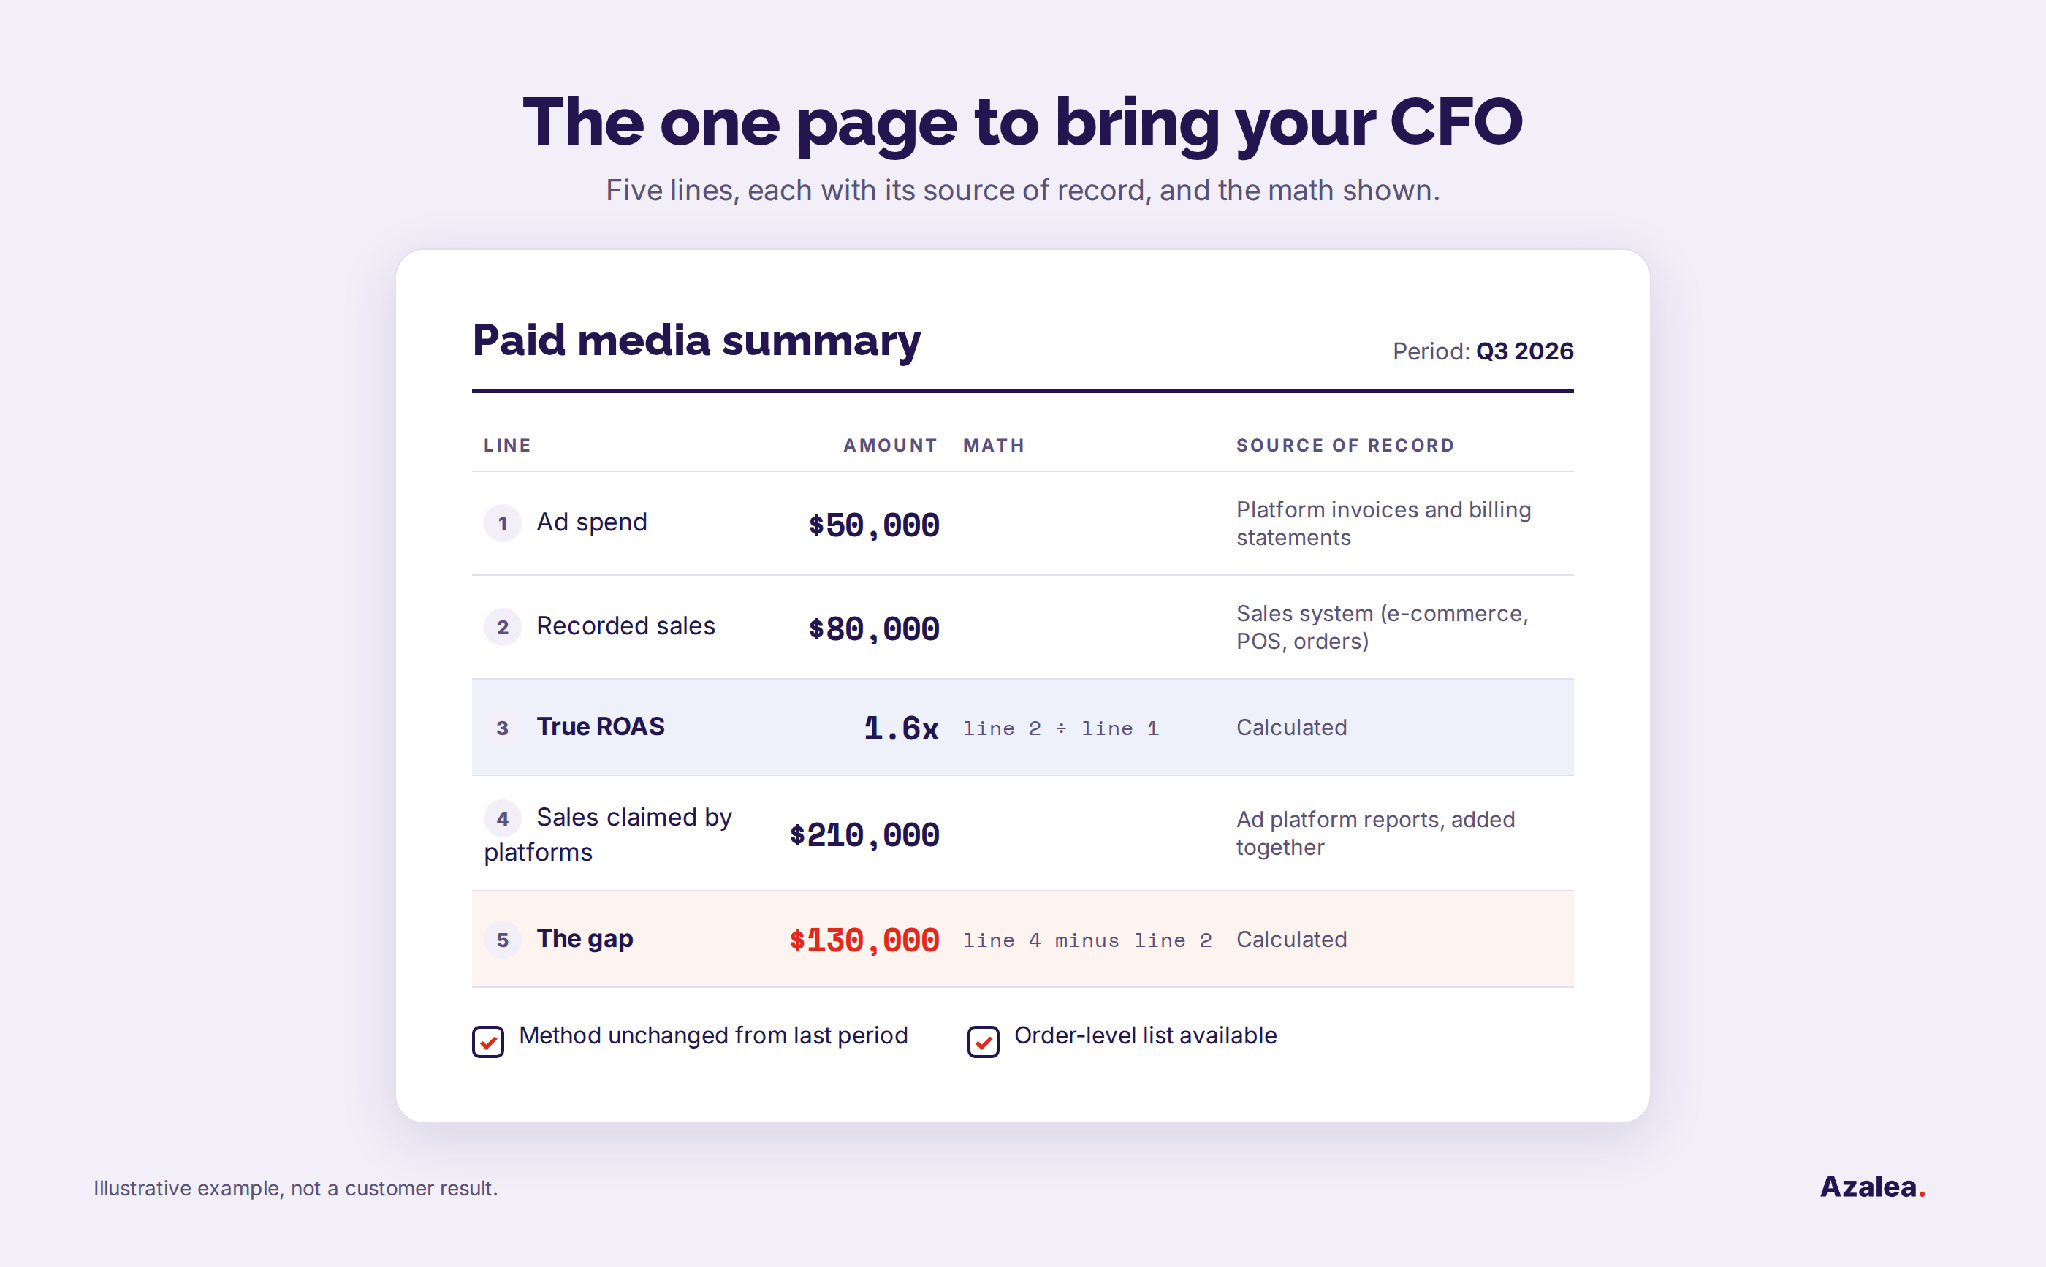
Illustrative example.
Five lines are enough:
Put the source of record next to each line, so the CFO knows where every number lives. Show the math on the page, too. When "line 2 ÷ line 1" sits next to the result, finance can check it in seconds instead of asking how it was calculated.
Use the same method every period. Consistency is what turns one good quarter into a number of finance trusts. If you change anything, like adding a sales channel or changing how refunds are counted, note it on the page.
Keep the order-level list ready. You may never need to hand it over, but being able to say "yes, here are the orders" settles most doubts quickly.
One last tip: send the page to finance a day or two before the meeting. A CFO who has already checked your numbers walks in ready to talk about the budget, not the math.
"Where does this revenue show up in our books?"
In the sales system, the same records finance already uses. Every dollar of recorded sales traces back to an order, and finance can pull the same report to spot-check it.
"Why is this so much lower than the ad platforms say?"
Platforms share credit for the same sale, include modeled and view-through conversions, and use their own time windows. Recorded sales count each sale once. That's how the platforms count, not an error, and the page shows the gap between the two.
"Does this prove the ads caused these sales?"
No, and it's worth saying so plainly. True ROAS compares recorded sales with ad spend for the same period. It doesn't prove what caused each sale. Stating that up front makes the rest of the page easier to trust.
"Can I see the orders behind the number?"
Yes. The order-level list is ready whenever you want it.
"Does the spend tie to our invoices?"
Yes. Spend comes from what the platforms billed.
"Is this calculated the same way as last quarter?"
Yes. Any change in method is noted on the page.
"How are returns and cancellations handled?"
Recorded sales reflect what our sales system records.
"What happens if we cut the budget by 20%?"
Be honest: this measure reports what happened. It doesn't forecast. What it does give you is a trusted baseline, so if you test a change, you can see what actually happens to recorded sales.
A smaller number you can defend beats a bigger one you can't. When marketing brings true ROAS built from recorded sales and billed spend, the budget meeting stops being a debate about whose numbers are right. Marketing and finance work from the same records, and the conversation moves to what to do next.
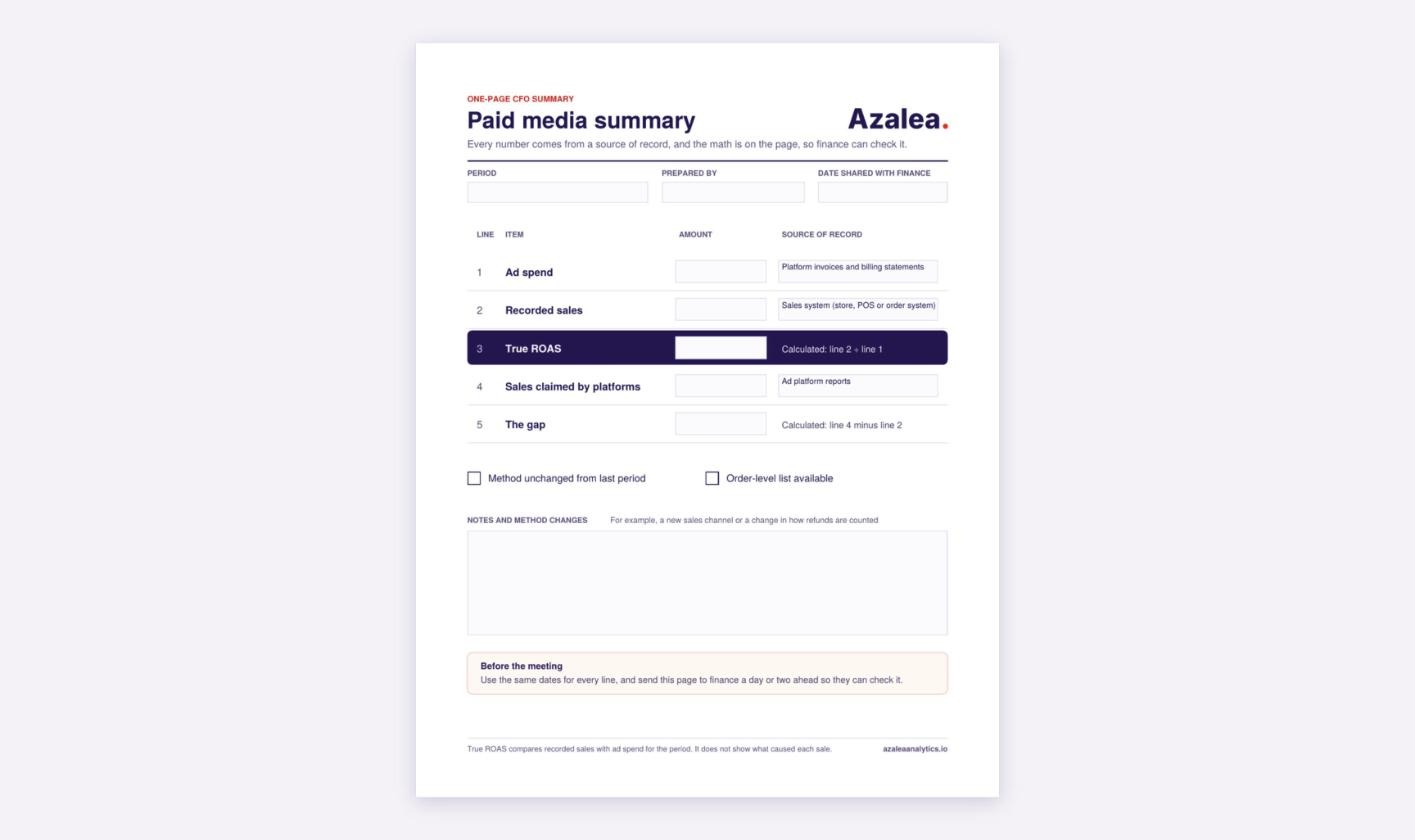
Download the one-page CFO summary template to build yours, or let Azalea keep it current for every brand and campaign. Let your marketing bloom.
Still choosing a tool to do this for you? Our buyer’s guide, How to Choose a Marketing Analytics Solution, walks through the questions to ask every vendor.
Karrington Ogans is a Project Manager at Azalea, specializing in the deployment of AI-driven tools and advanced technical workflows. She holds a B.A. in applied mathematical sciences from Gonzaga University and a certificate in AI prompt engineering. Throughout her career, Karrington has driven technical execution from the ground up: at the Fred Hutchinson Cancer Center, she assisted in engineering real-time object detection models and augmented reality tools for lab research, while at LabLight AR, she built custom LLM-powered AI agents to automate scientific workflows. Backed by deep hands-on experience, she focuses on managing custom datasets and presenting live technical demonstrations to audiences ranging from bench scientists to cross-functional stakeholders.
Based on Illustration 2. A fillable, letter-size PDF with blank fields for period, ad spend, recorded sales, true ROAS, sales claimed by platforms and the gap, a pre-labeled source-of-record column, and checkboxes for "Method unchanged from last period" and "Order-level list available." It also has a notes box for method changes and a one-line reminder to use the same dates and share the page ahead of the meeting.